ABSTRACT
Discussion invoking tensegrity principles to elucidate action within mammalian physiology is currently prevalent. Here a simple experiment is discussed that uses accelerometer data to examine shock absorption characteristics of a Tensegrity Tower, relative to a solid block. The goal is to support establishing a sensory mechanism for evaluating tensegrity mechanisms in animal movement.
PROBLEM STATEMENT
Although tensegrity is a powerful model of human biomechanics superseding the traditional kinematic chain model, supporting evidence is dominantly subjective, particularly within movement dynamics. The lack of empirical metrics for assessing the presence of tensegrity mechanics limits its widespread diagnostic and therapeutic utilization. Here, an experiment is performed graphing the deceleration of a tensegrity structure and solid block in the gravitational vector, i.e., dropping these objects 4″. It is posited that tensegrity in action presents in the graphs as a more complex response to rapid deceleration, providing a signature for its effect.
This experiment explores the potential of such analysis to affirm tensegrity mechanics as a fundamental structural/functional principle within biological systems. By examining how these systems respond to variations in acceleration, the study aims to demonstrate inherent differences in deceleration dynamics between structures based on tensegrity principles and those that are not. These differences may at a more detailed level infer a gradient of tensegrity within the dynamics of animal movement.
This blog features a series of posts that delve into the kinematics of tensegrity in animals.1
DATA ANALYSIS
Tensegrity Tower Data Analysis:
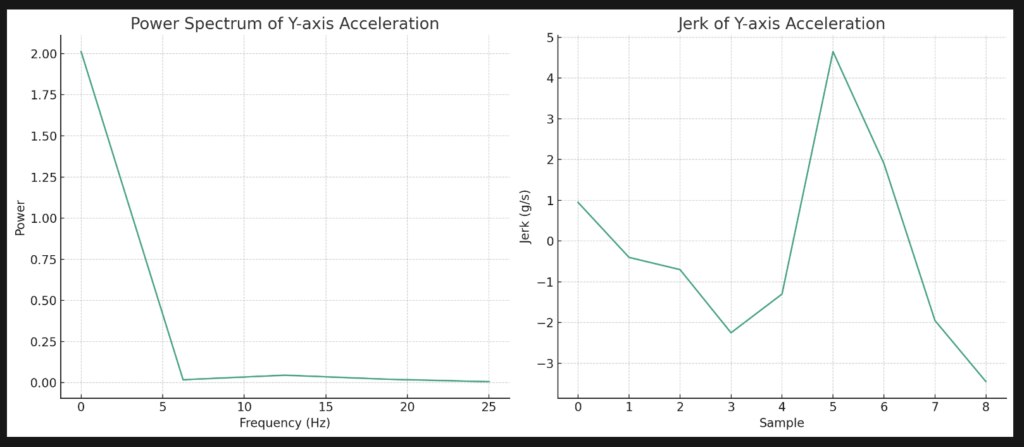
- The first plot is the deceleration characteristics of a Tensegrity Tower, as pictured above, dropped 4″.
- The sample rate is 50 Hz. (Nyquist: 25 Hz.)
- Both the power spectrum using a Fast Fourier Transform and the Jerk (rate of change in acceleration) of the vertical axis are shown.
- Note that the power spectrum tapers off by about 7 Hz. and stays low as the frequency increases, indicating that most of the energy is translated into the low-frequency area of the power spectrum.
- In the Jerk graph, note that the absolute values of Jerk do not exceed 5G’s and Jerk is distributed over the sample.

Block Data Analysis:
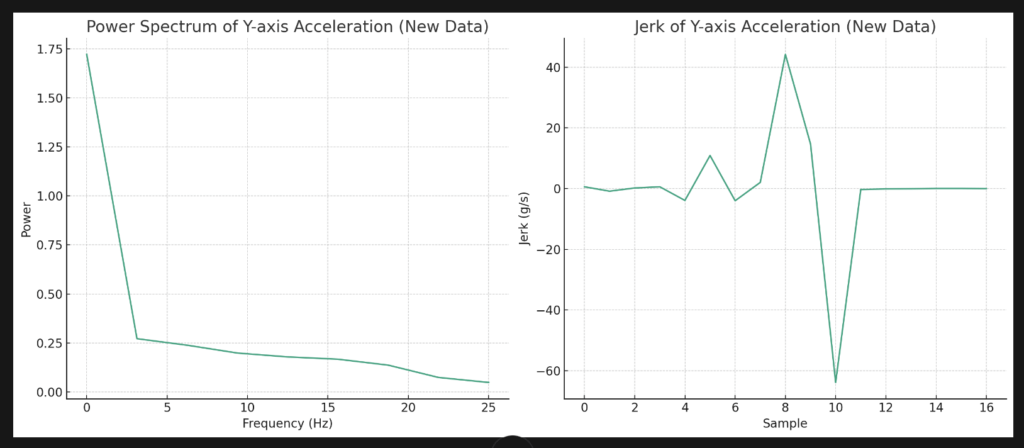
- The second plot is a block of wood, also dropped 4″. (Nyquist: 25 Hz)
- The power spectrum in the first graph has a significantly lower proportion in the < 7hz. range.
- The magnitude of the Jerk is > 8X the Tensegrity Tower sample, with the energy more tightly coalesced within the abrupt change in velocity as the block stops falling.

Mean Amplitudes:
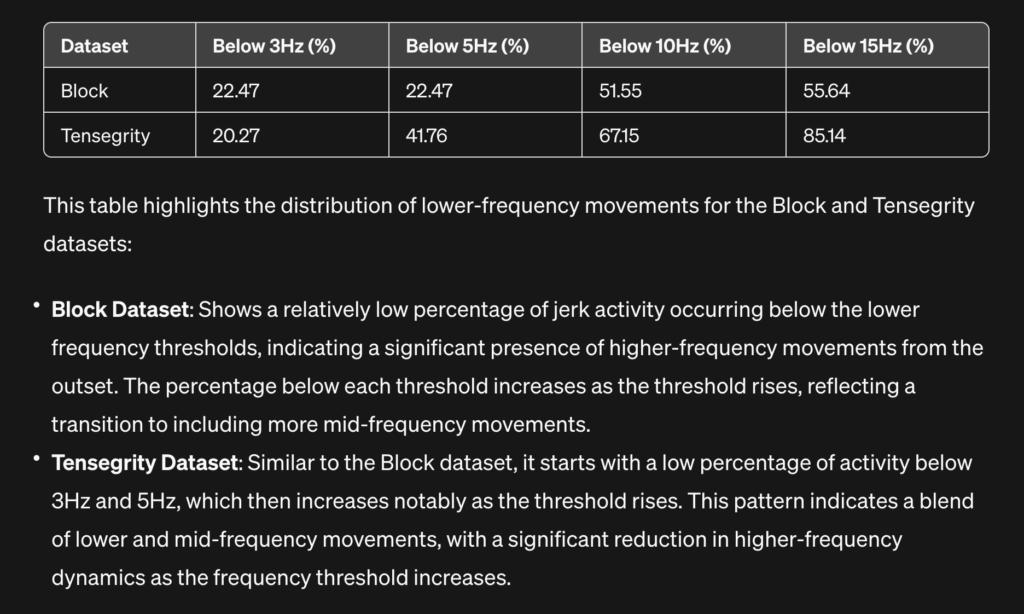
The mean amplitude of the Power Spectrum for the Block dataset is approximately 0.337, and for the Tensegrity dataset, it is approximately 1.070. This indicates that, on average, the Tensegrity dataset has a higher power across its frequency components relative to the Block dataset, aligning with the observation that tensegrity systems distribute energy at lower frequencies.
Witin an action,
the Higher the Median Frequency
of the Power Spectra
of Jerk in the Vertical Axis,
the Greater the Tensegrity Dynamics
CONCLUSIONS:
These metrics for evaluating attributes of motion have been studied here in the context of developing a tool for the evaluation of human gait patterns, where there is a significant correlation of these metrics to qualities of gait2.
The correlation is that the power spectra of the rate of change in acceleration in both tensegrity structures undergoing rapid deceleration and in an active gait pattern both express greater dominance of the lower frequency components.
Within movements/actions of animals, tensegrity biomechanics can be evaluated using the rate of change in accelerations (Jerk) and the median frequency of the power spectra of Jerk.
More Discussion:
This small study of Tensegrity infers that that work also describes tensegrity physics in biomechanics, in that there is a correlation between gait dynamic and tensegrity dynamic responses. This correlation is explored in this post:
KINSEGRITY: KINETIC TENSEGRITY
The inference for our health is that the higher the median frequency of the energy on movement (the greater the low-frequency component), the more information is available for the creation and recreation of our bodies. The supporting science for this statement is discussed here:
MECHANOTRANSDUCTION FOR FIBROBLASTS AND OSTEOBLASTS
TENSEGRITY/ACCELERATION DEMONSTRATION
Demonstration of the response of a Tensegrity Ball to sudden changes in velocity. The structure of the ball is incrementally degraded so that its tensegrity response can be evaluated as this occurs.
FOOTNOTES
- KINSEGRITY POSTS ↩︎
- This study can be found here: A COMPREHENSIVE DESCRIPTION OF GAIT ↩︎
SYNOPSIS OF THE STUDY
If you would like to explore these dynamics the .csv files and prompt are provided

PROMPT:
Calculate the absolute maximum Jerk and the median frequency of the power spectra of Jerk for AccY(g) in the attached file
.02 second sample rate – do not use the time stamps.
libraries: Pandas, NumPy, SciPy.signal.welch


